Water Metrics compares two pieces of water usage information both physically and digitally. Two rectangular bars ascend and descend to offer a highly visual comparison of two quantitative pieces of information, while the digital touch screen centerpiece shows the type of info being displayed and the exact quantities. The digital interface is customized and can be used to select and display any set of water related information, from simple to complex. For example a water monitor device attached to a sink drain pipe (which measures quantity and temperature of water used) synced with the Water Metrics display can be used to compare how much water was used yesterday with the projected amount for the current day, compare water bill costs, or use the temperature data to display comparisons of past and projected energy bill costs. Water usage information can also be compared with data from other household water systems to inform the user about methods of expanding their efficiency efforts.
Photo of final model: top of sliding bars.
Photo of final model: touch screen interface.
Photo of final model: sliding motion of bars.
Web images: summary of Methven research I conducted includes company history and goals, corporate identity, target markets and global presence.
Web images: investigation of Methven products helped me understand the company's form language.
Personal documentation of my daily water usage provided insight to how much I rely on clean water and the many ways I interact with it.
Documentation of my water usage related to cleaning and hygiene led me to realize how wasteful most residential water systems are. By not separating gray water and black water waste streams, huge quantities of water are misused every day. Gray water from sinks, showers and washing machines can often be treated and recycled on site or at least used in toilets.
Web images: previous documentation of my water usage inspired research of various methods for water capture, cleaning use and reuse. At this point I became convinced that raising awareness of how we use water and how much we use is essential to reducing waste. This realization made me pursue the design of an informative household product.
Web images: research of products which capture, clean, recycle, and monitor usage of water. One common flaw among the water usage display products is that they only show information on digital screens which are static and have little visual presence. For important information such as water use, a strong visual presence is essential in keeping the homeowner aware.
After looking into a variety of methods for water capture, treatment and reuse I mapped out potential flow connections between components of a residential water system. This helped clarify what types of information would be useful to compare and display for the homeowner.
Initial concepts for residential water use info displays. Every concept includes physically moving components to represent quantitative data because real movement has a much stronger visual presence than motion on a digital screen. All concepts display two or more pieces of info at a time to provide a basis of comparison: such as the total household water use last week compared to the projected use for the current week, or the amount of water used yesterday in the kitchen compared with the water used yesterday in the bathroom.
Photo of one initial concept sketch model, computer renderings at left. Constructed with laser cut and etched acrylic, the two white bars slide up and down to roughly compare quantities of related water usage info while the central black band houses a touch screen showing the types of info being displayed and exact quantities.
Development sketches of the sliding bars concept.
Color palette considerations explored with solidworks model rendering.
Solidworks and adobe illustrator renderings of several touch screen information display options. The main image shows the comparison between the total amount of water recycled in the household yesterday with the projected amount of water recycled today. Smaller images of touch screen displays from left to right: total water recycled last week / projected total water recycled for current week, gray water recycled yesterday / projected gray water recycled today, total water used yesterday / projected total water used today, black water created yesterday / projected black water created today, gray water created yesterday / projected gray water created today, water bill cost yesterday / projected water bill cost today.
Solidworks render of final concept: two large sculpted bars that slide up and down and a fixed protruding central touch screen display which references the form of a water drop.
Fabrication of the final aesthetic model was a process of digital modeling, CNC router cutting for the sliding bars and digital interface housing, hand sanding, priming, spray painting repeatedly, laser cutting and transparency film printing for simulation of touchscreen display, hand work metal trim, construction of a mounting wall for sliding bars and fixed digital display, and finally careful assembly of all components.
Photo of final model.
gLike
Water Metrics

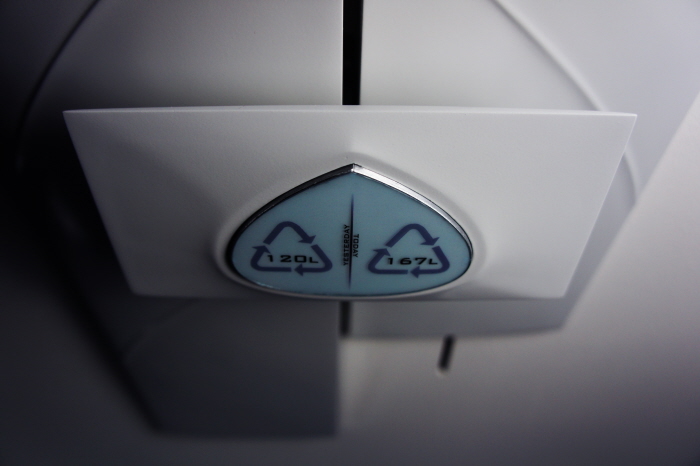
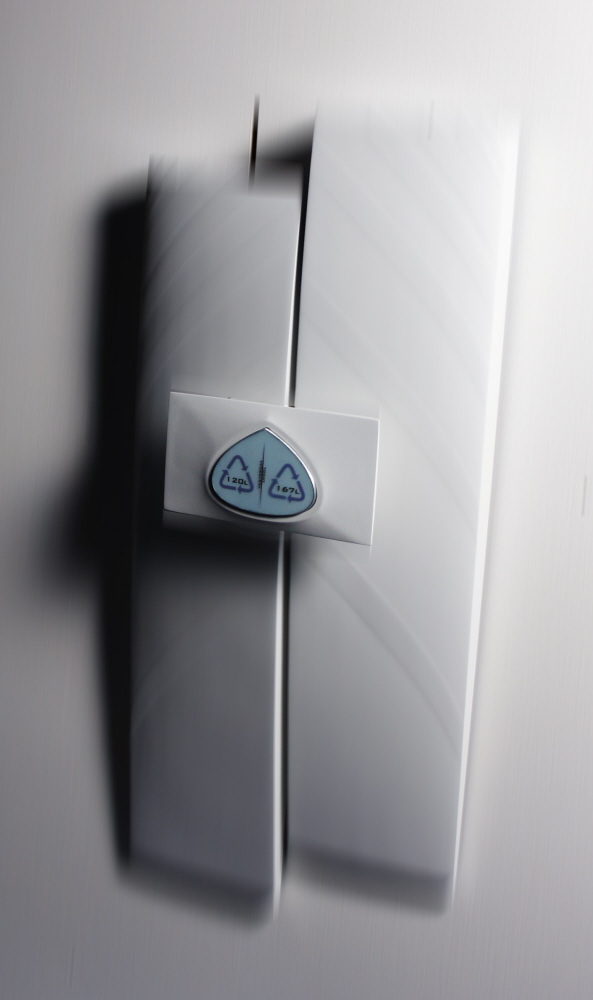
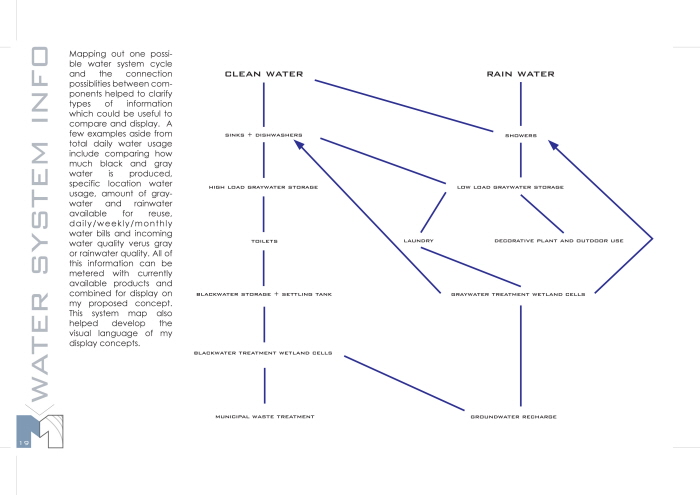
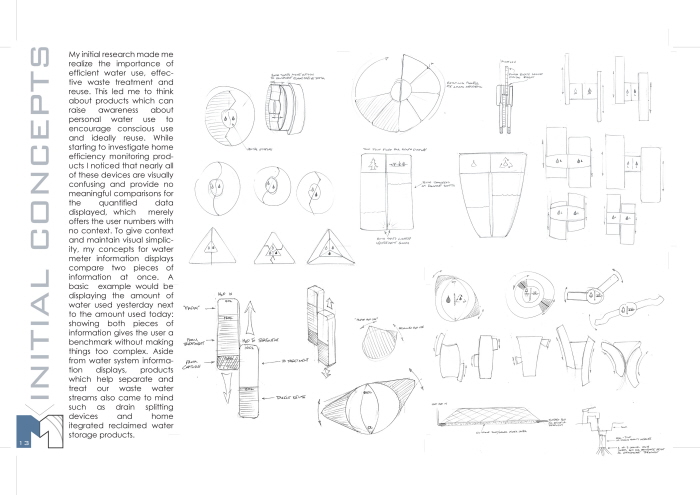
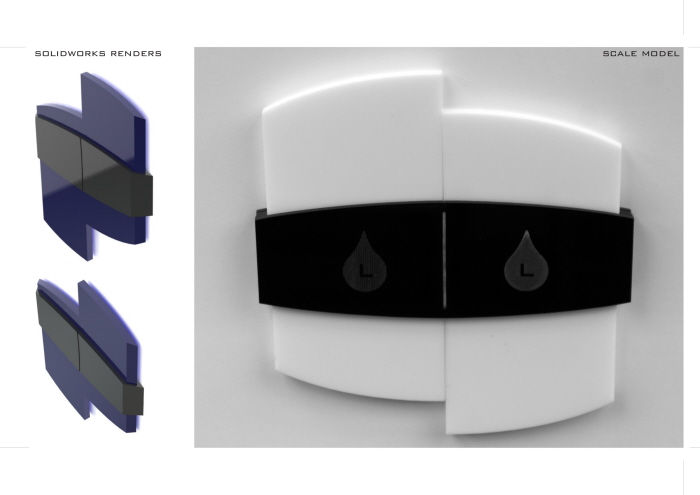
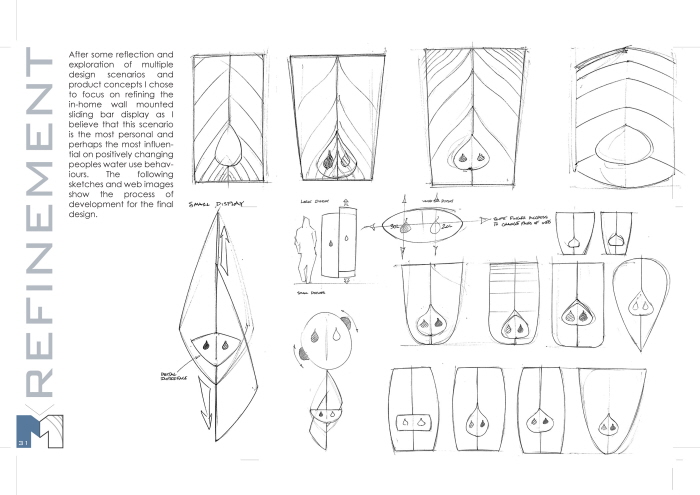
Water Metrics is a household water usage information display concept proposal for Methven, a New Zealand-based international bathware and faucet design/production company. Currently most residential consumption monitors are visually complicated, confusing and therefore ineffective. This product aesthetically combines and compares water quality and quantity monitor data from different parts of the household water cycle. By comparing two pieces of information side by side such as the amount of gray water produced last month to the projected amount for the current month in a continuous, highly visible way the user can learn more about how they use water and be encouraged to use less or use it more efficiently. This series of images outlines the design process which led me to the final product concept.