
World Of Images - This involved studying images of all kinds collected from various sources and developing a new categorizing scheme for the same. The scheme was developed by understanding how images differ based on the information or message they communicate.
The final deliverable was an educational poster depicting the vast number of different kinds of information in form of images we see everywhere around us.
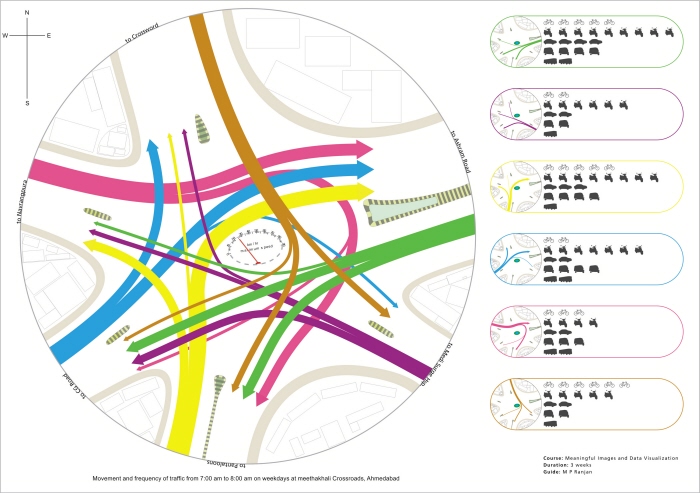
Traffic Visualization - This depicts information gathered at a crossroad. The frequency of different kinds of vehicles and the traffic flow provided an interesting opportunity for visualization. The flow is depicted and distinguished for different directions using colours and relative width. The frequency of different vehicles is represented by icons. The visualization depicts the average flow and frequency of traffic for a duration of 5 minutes when the traffic is at its peak.
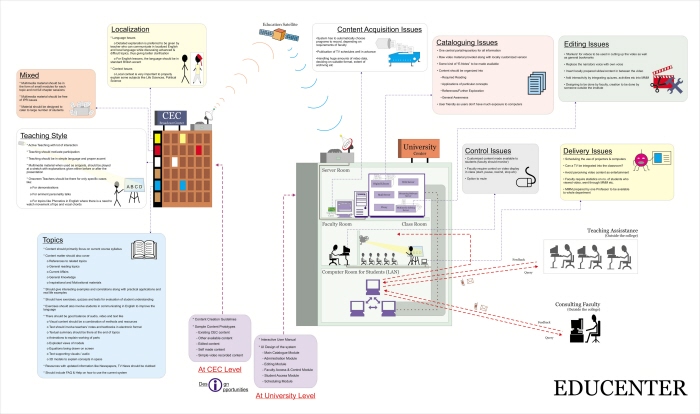
User Research Analysis - Information Visualization of System Design for Distance Learning at Indian Universities. The model was proposed after contextual enquiry conducted at colleges of Kerala.
gLike
Information Visualization