
Ride Sharing Tendencies - Results of User studies on Carpooling. The graphic represents the result about which people prefer to share their rides. The variables include distance of travel [long-short] on X axis, regularity of travel on a particular route [regular-irregular] on Z axis and organised schedules [organised-unorganised] on Y axis. The size of Tyre is proportional to the tendency of sharing.
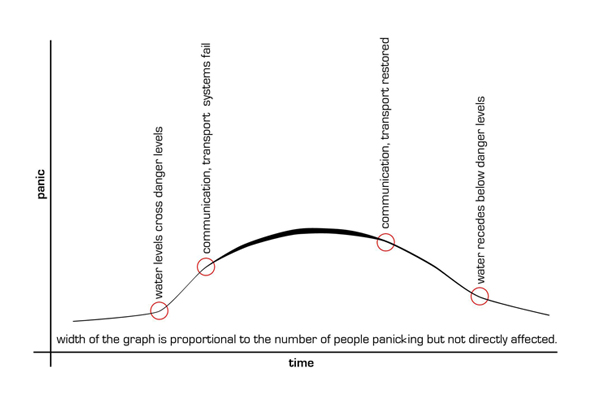
Panic Pattern in Floods - Thichkness of line indicates panic by people who are not directly affected by the calamity.
Panic slowly rises with the water level and then increases drastically once they reach danger zones. It continues to rise till all the modes of communication & transport are affected, then the people who are not directly affected like relatives of the residents of the flooded areas add to the panic.
The panic levels & life begin to come back to normal as water levels start receding below danger zones.
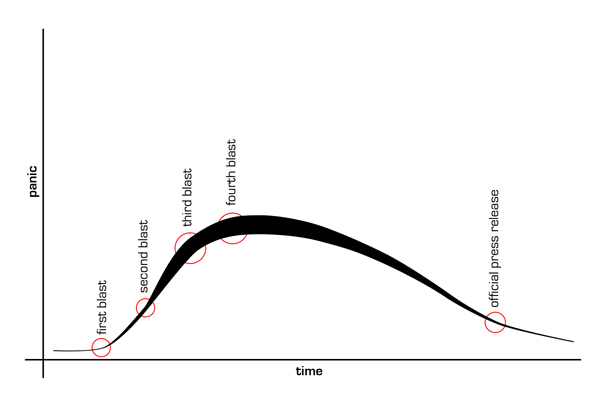
Panic Pattern in Serial Bomb Blasts - The thichkness of line indicates panic by people who are not directly affected by the calamity.
There is no gradual increase in the panic before the first blast as it is a totally unexpected event. But after that the rise is very steep. After the second blast the graph widens drastically as the second blast establishes a possibility of serial blasts and people who were not affected start panicking. The third and fourth blasts don't cause any dramtic changes because they are relatively expected.
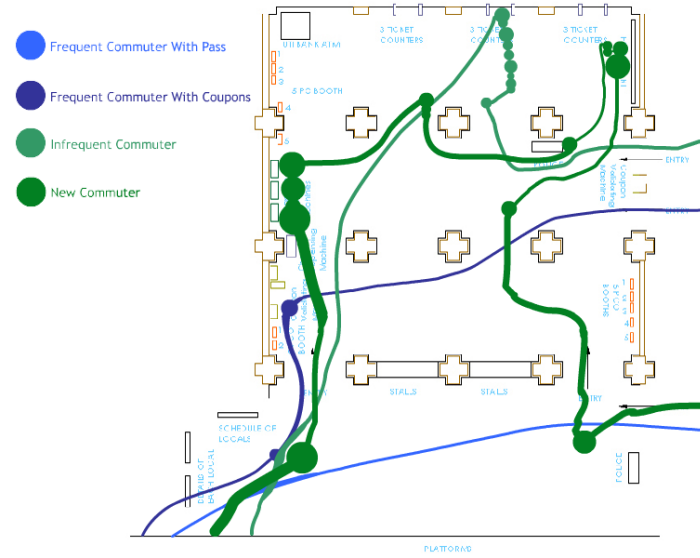
Flow of Users in Space & Time - A visual showing the observations of study done at ticket counter at Chatrapati Shivaji Terminus, Mumbai.
The spots depict the time a user has spent on a particular place. Thick lines indicate slow pace of walking and thin lines a brisk strut. This graph gives a lot of insights into how expereince of a user changes his presence in the premises.

Activities on Mumbai Suburban Train - The visual shows compartmentwise activities on a local train. Very insightful in knowing the cultures that emerge out of the commuting classes. Key points could be first class invest their time in activities like reading, in second class people prefer to rest and in ladies class the most preferred activity is chatting!
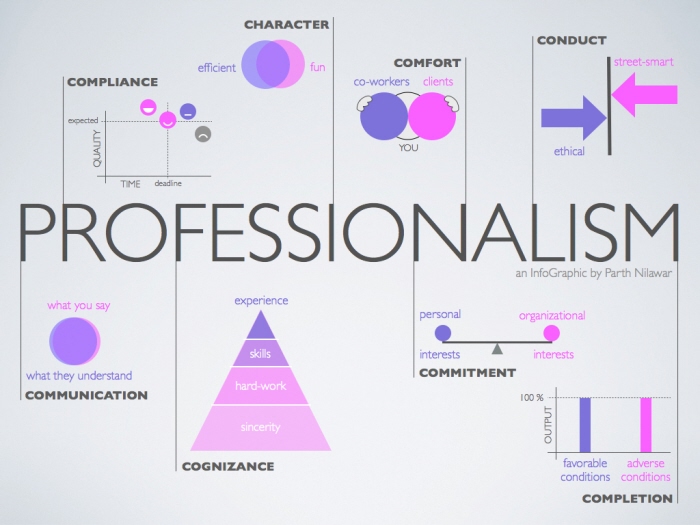
Professionalism - A summary of research carried on to understand what does 'Professionalism' mean to different people. It was very interesting exercise to describe an abstract concept with mathematical graphs and plots.
Around 40 people were interviewed with different professional backgrounds [artists, architects, designers, journalists, investment bankers, project managers, teachers, software developers and management consultants ].
gLike
Information Visualisation