
This is a custom tool created for clients. There were four variations developed, all included filters and the ability to drill down into the numbers themselves..
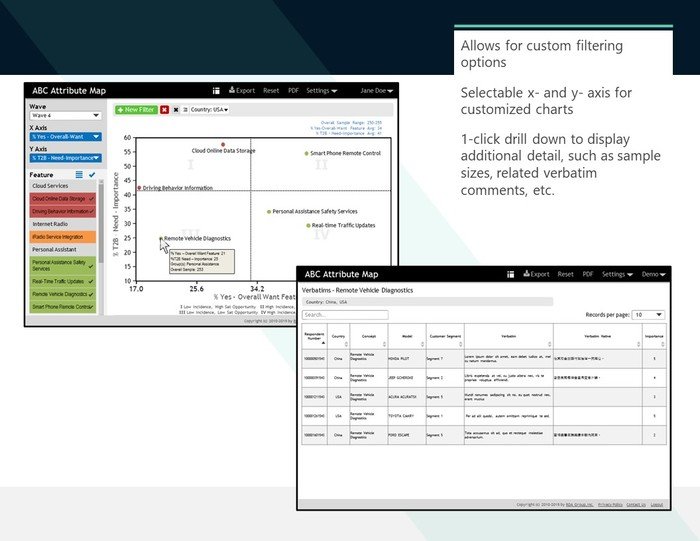
The tool was created to allow (depending on the specific variation of the tool) the end user to either drag an attribute point itself to see how that would affect the rest, or adjust the various filters to see what score would be needed to show an actual improvement. All four variations were designed to utilize high volumes of data, but showcase the end product simply for the end-user to easily see the story that the data is telling.
gLike
Data Analytics
Data analytics framework illustration