
Dash Board (Home page)
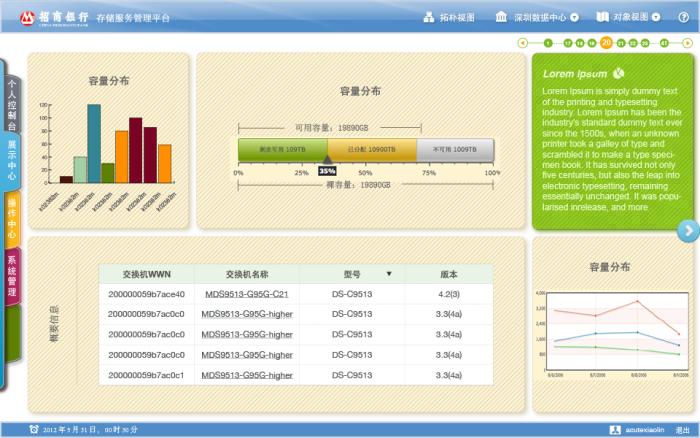
Every widget on the dashboard is clickable, and it flips around after single click showing additional contents.
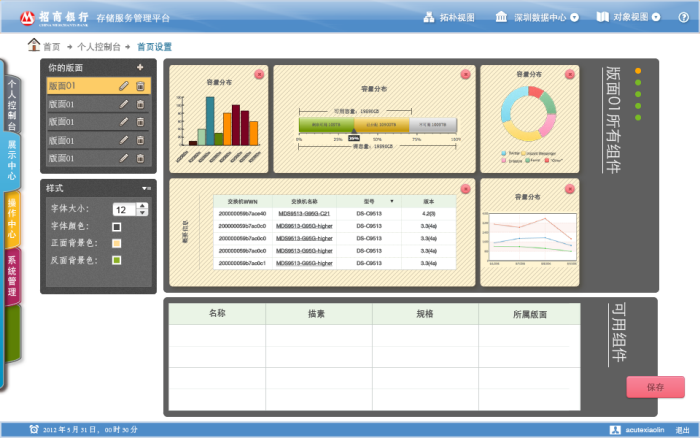
Custom Dashboard configuration page. The widget can be deleted and added.
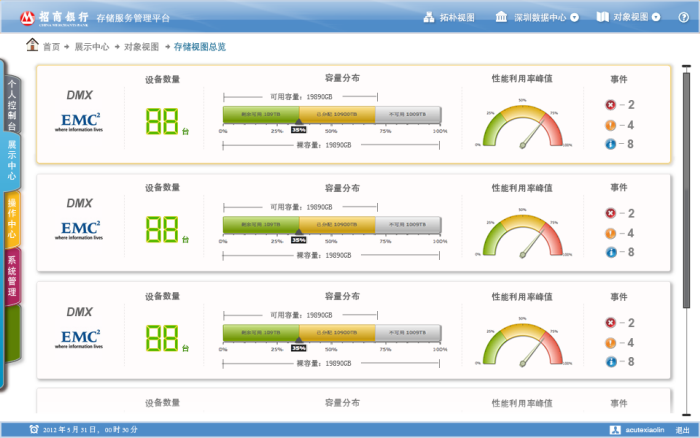
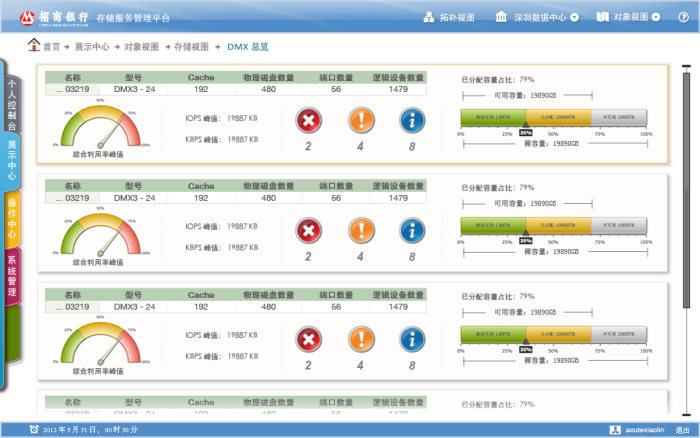
Overview for all the storage machines.
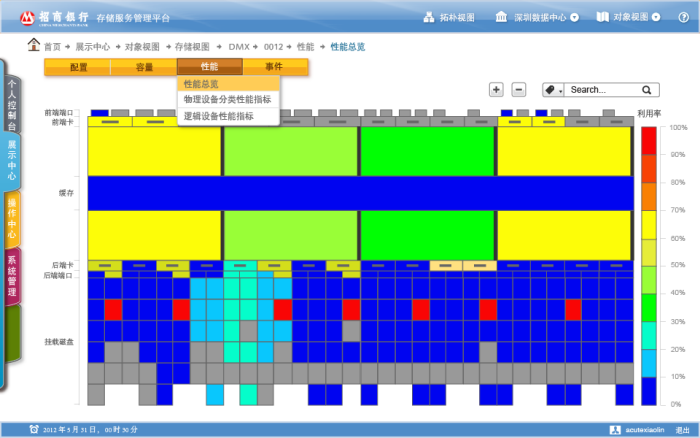
Heat Diagram
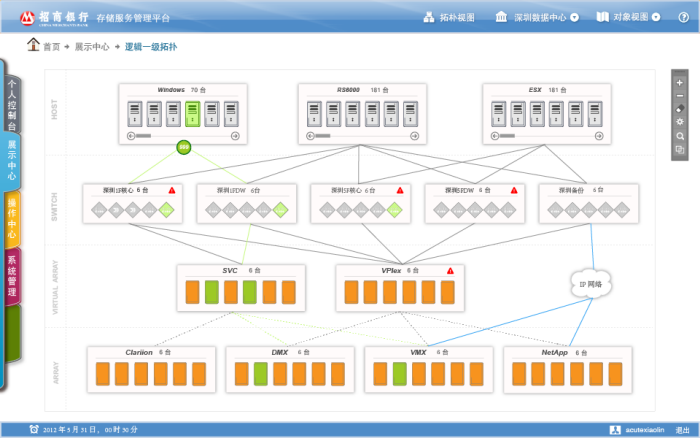
Topology Diagram. Arrays at the bottom can show different portion of colors to reflect the storage status. By single click, all the related machines will be highlighted by fresh green color.
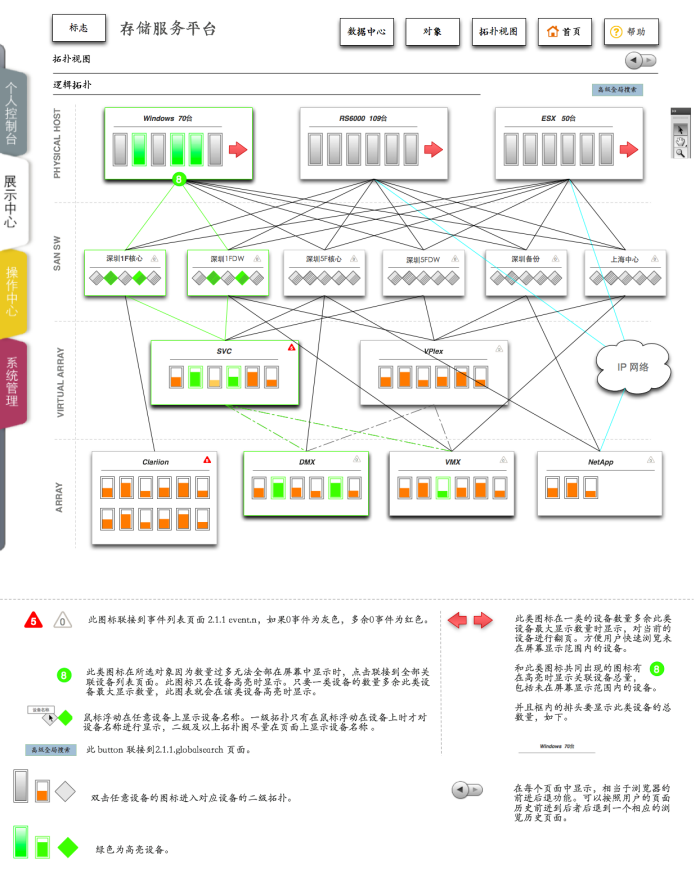
GUI For Topology Diagram
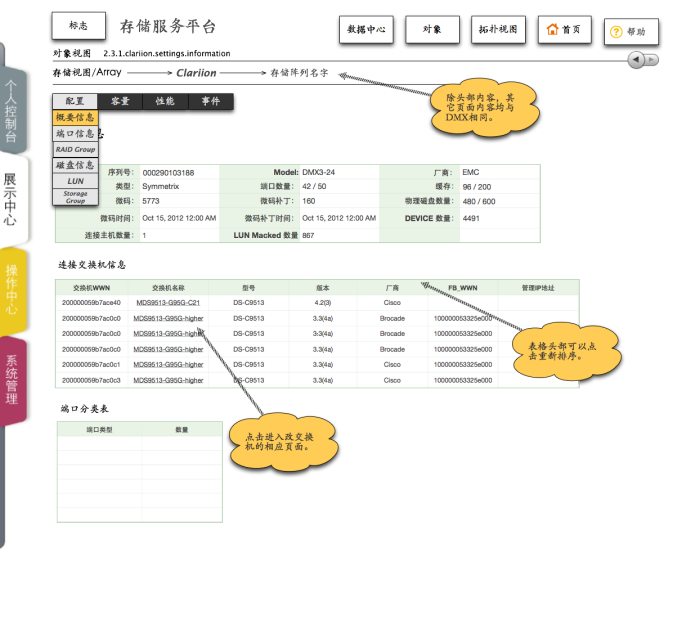
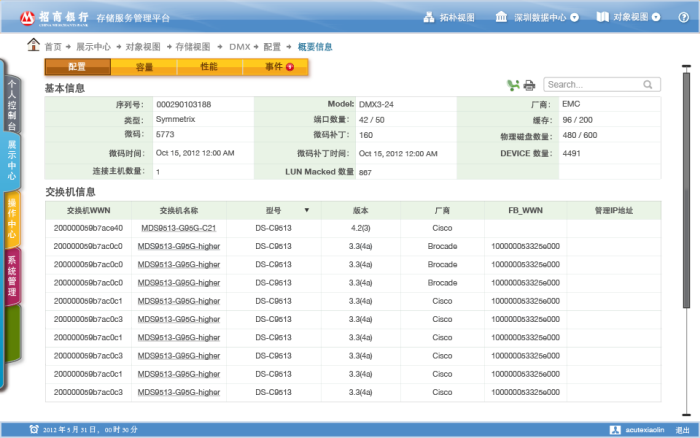
GUI for pages with table
gLike
Storage Management System
EMC needs an internal Management system for storage machines, a platform that shows the status of all their machines, that includes all the hosts, switches and arrays. Thus this system can quickly help their customer visualize which machines have what kind of problems, what are specifications of each of the machine and their connections with each other. The system shows all those things both verbally and visually.
Xiaolin Wang
Freelance UI Designer, Flash/Flex Developer, Front-end Developer, Photographer
Beijing, China