

Figure ground diagram of the region around our site.
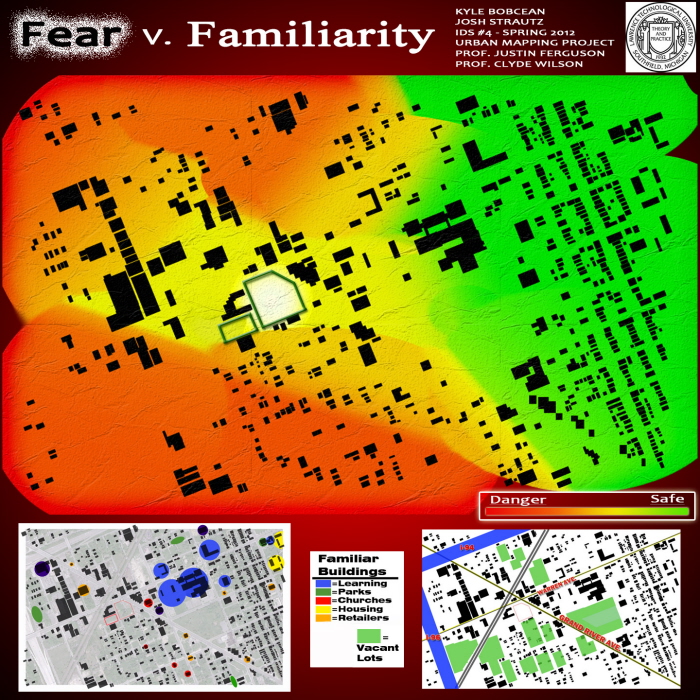
Fear vs. Familiarity diagram that represents the dangerous and safe places based on our initial site analysis.
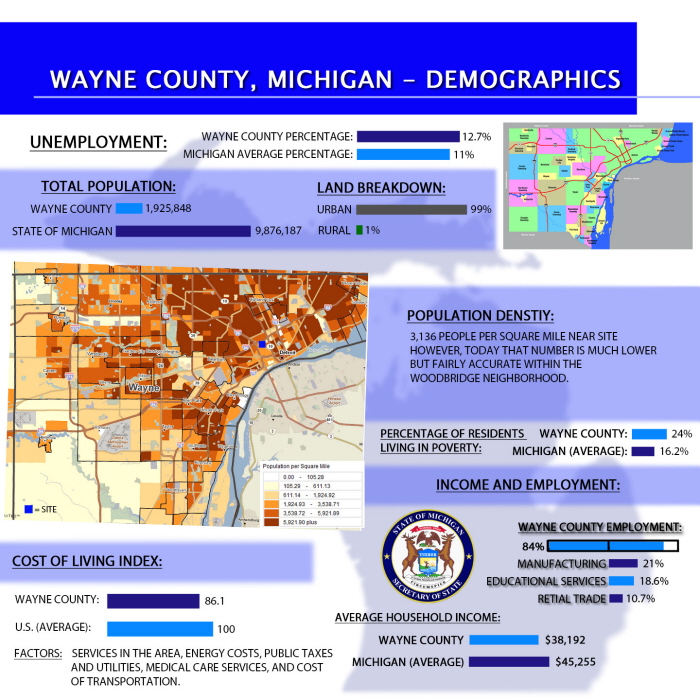
Demographics and statistical analysis of the region.

5-10 year potential urban development diagram

10-15 year potential urban development diagram

15-40 year potential urban development diagram
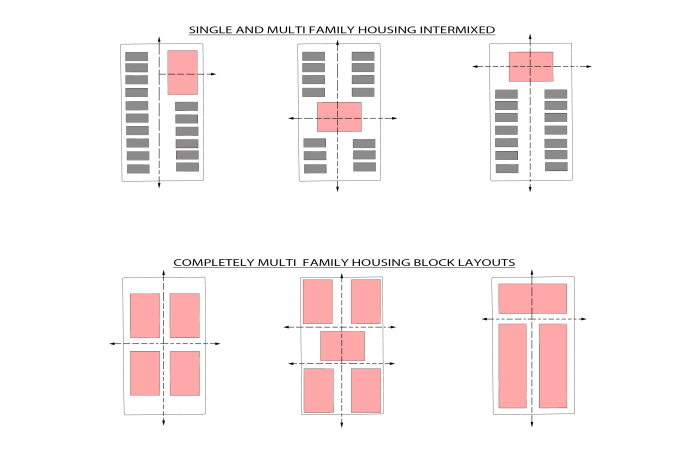
Neighborhood layout diagrams that include variations of housing and work/live buildings.

Diagrams and variations of the different neighborhood layouts with the surrounding context.
gLike
Urban Analysis for Community Development
The goal of this in depth analysis is to gain a better
understanding of the area and its surrounding context.
Based on this knowledge it can then be put forth into
the design of the entire project.
