
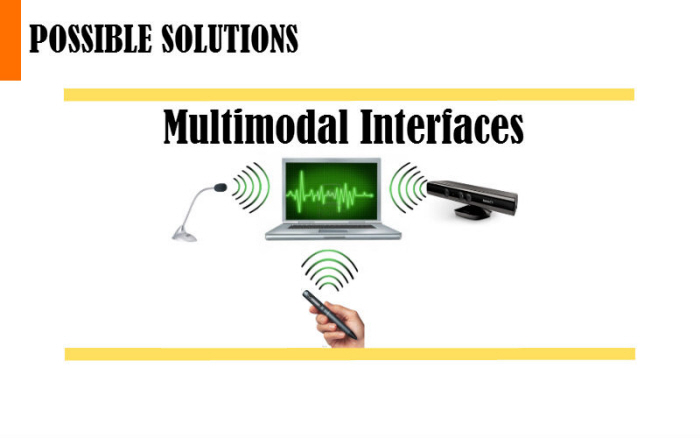
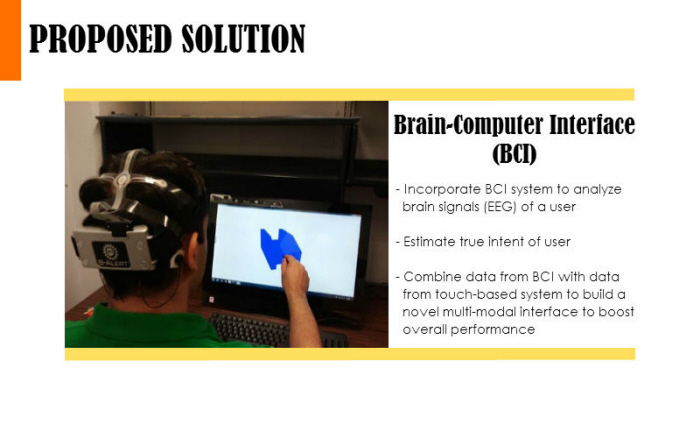
The aim of this project is to explore how multimodal Computer Aided Design (CAD) interfaces can be developed by integrating brain-computer interfaces (BCI) and touch-based systems. This integration is proposed in order to help reduce the ambiguity associated with 2-dimensional (2D) touch-based gestures on 3-dimensional (3D) touch-based applications.
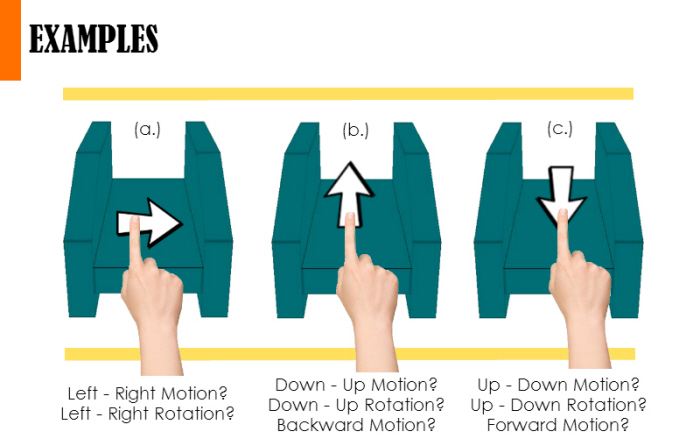
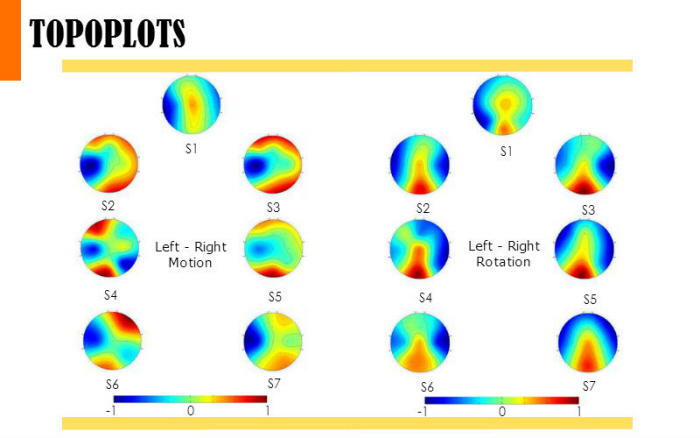
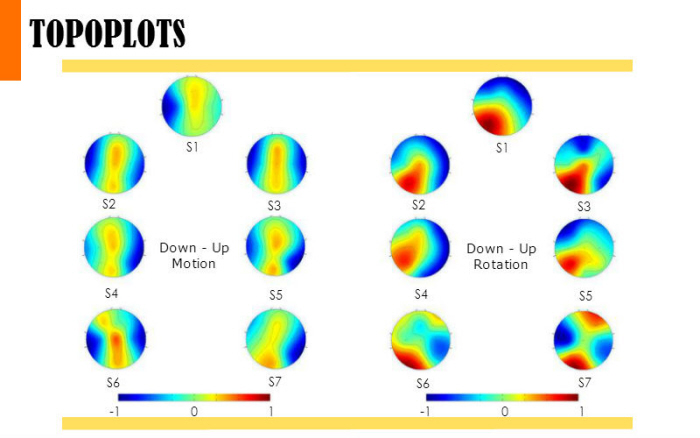
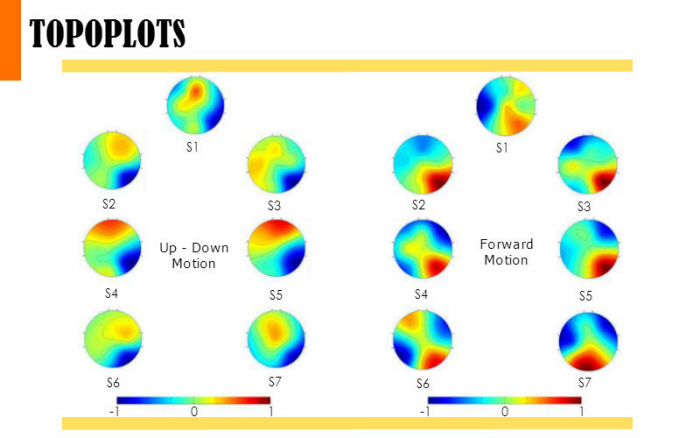
Gestures on a touch-based system are subject to ambiguity in recognition since they are 2-dimensional in nature and could lead to multiple interpretations, more specifically when used to operate a 3-dimensional application. This project describes a novel method to utilize brain signals of users to help resolve this problem.
The project was carried out as a part of my thesis requirements under the guidance of Dr. Ehsan Tarkesh Esfahani, Assistant Professor, University at Buffalo, the State University of New York