
Pie Chart - Data illustration created for a Power Point presentation.
Copyright IHMS
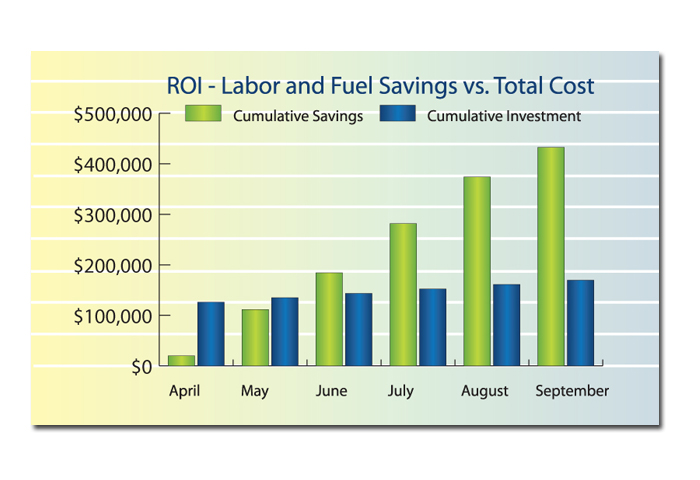
Bar Graph - ROI Labor vs. Fuel
Copyright Networkfleet
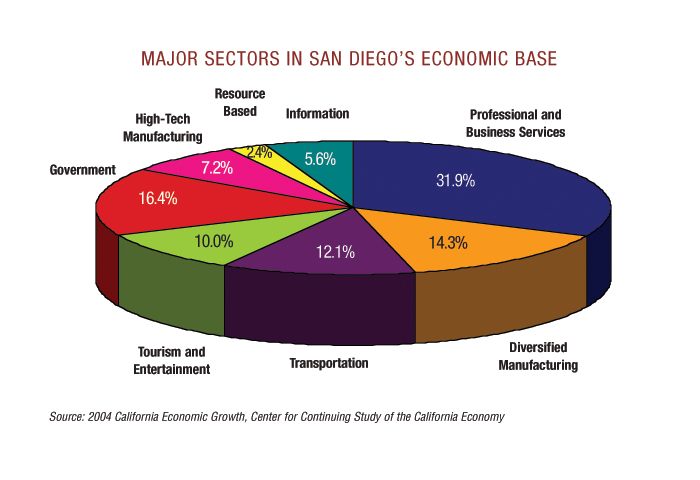
Pie Chart
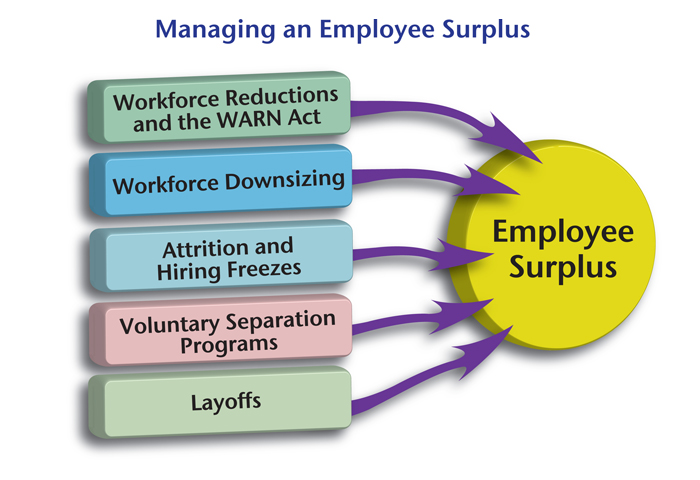
Diagram - Data illustration created for a Power Point presentation.
Copyright Center Group
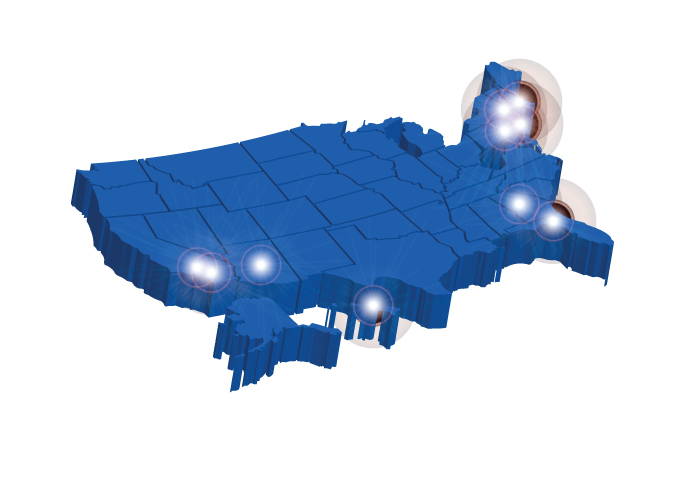
U.S. Map
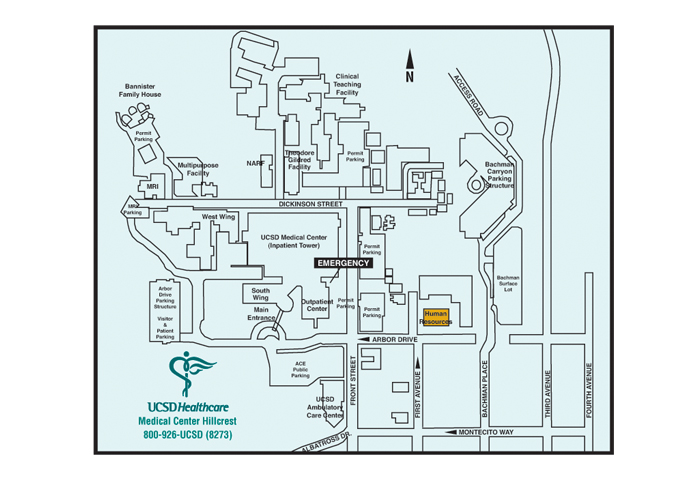
Map - Map created for various print materials.
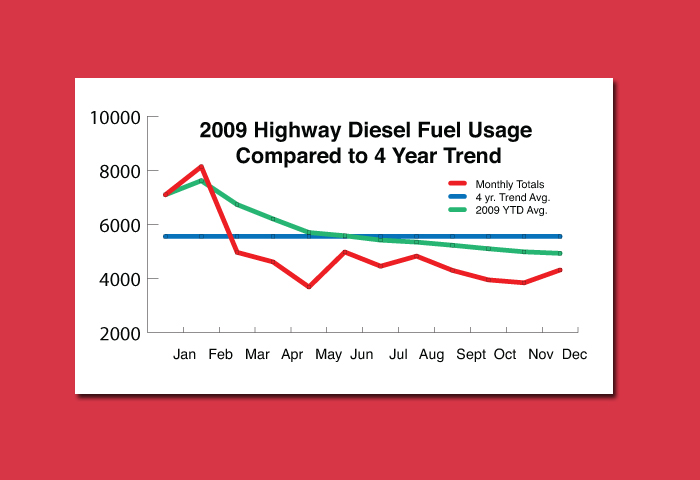
Line Graph
gLike
Illustration- Diagrams and Charts