

Company timeline
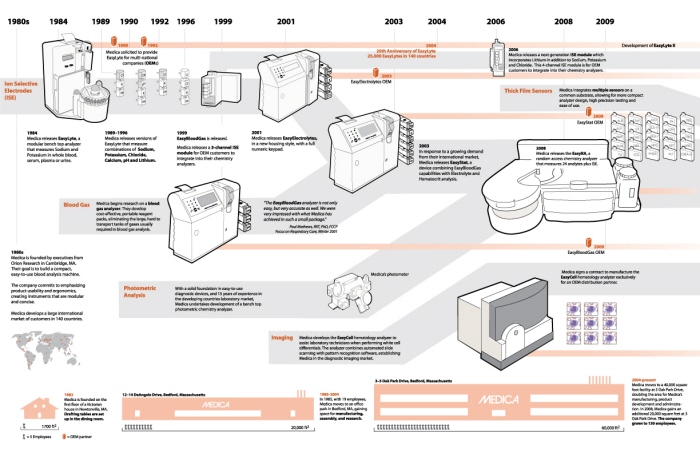
Company timeline
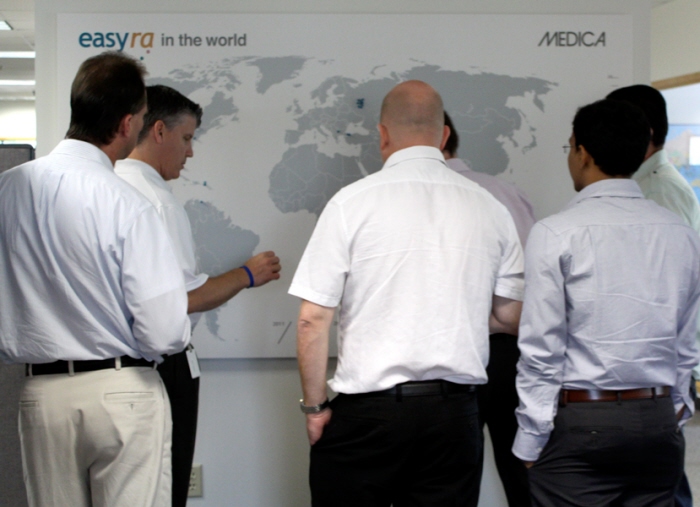
Interactive (lo-fi) map
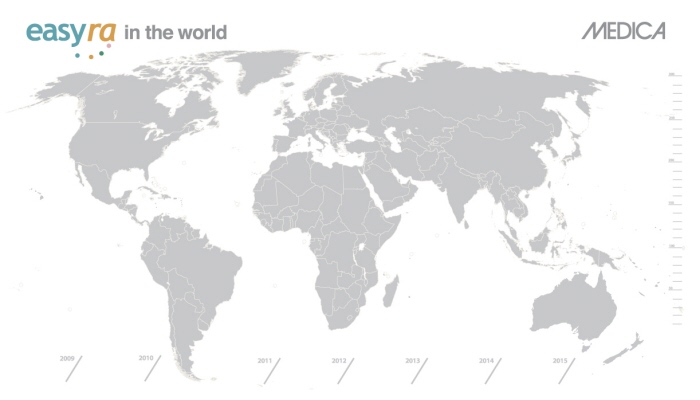
Interactive (lo-fi) map
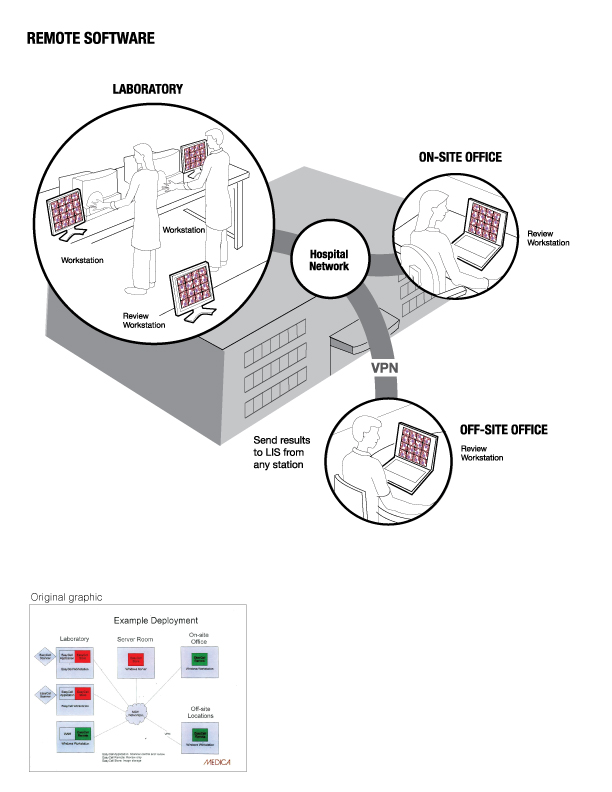
Software infographic - This graphic is used in a medical device product brochure. Using a technical flow chart for source material, I created a user-friendly graphic that more clearly emphasizes the product and tells a story. With the graphic, Sales and Marketing is able to help customers understand the product quickly and easily.
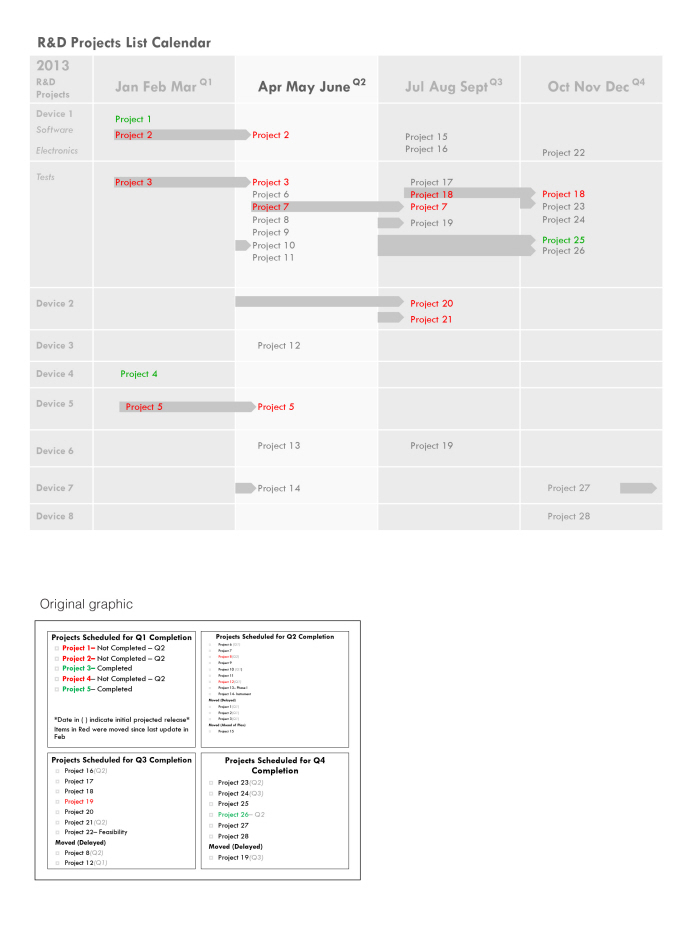
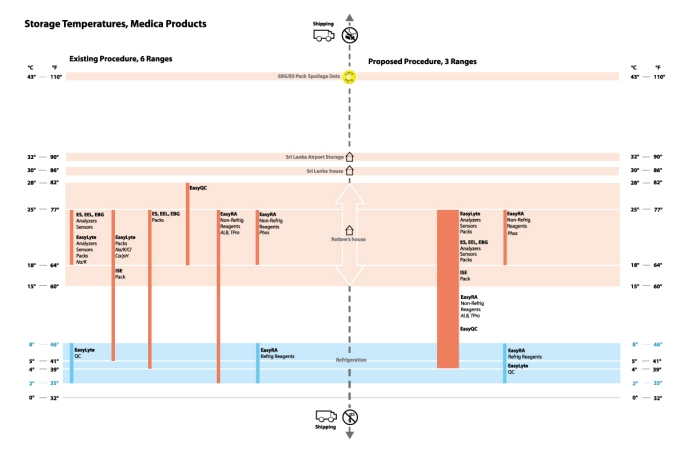
Storage temperature chart
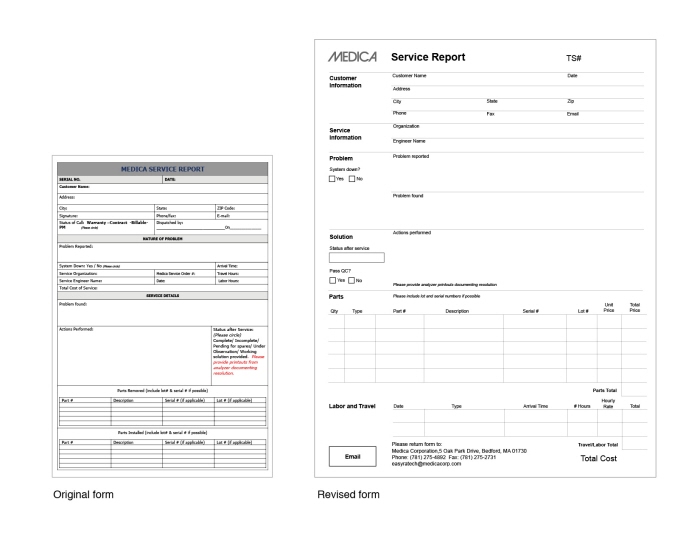
Service Report Re-Design - Revised and updated form used by service technicians in the field. Interviewed users and gathered information about current practices. Re-design included setting up document to be filled out electronically.
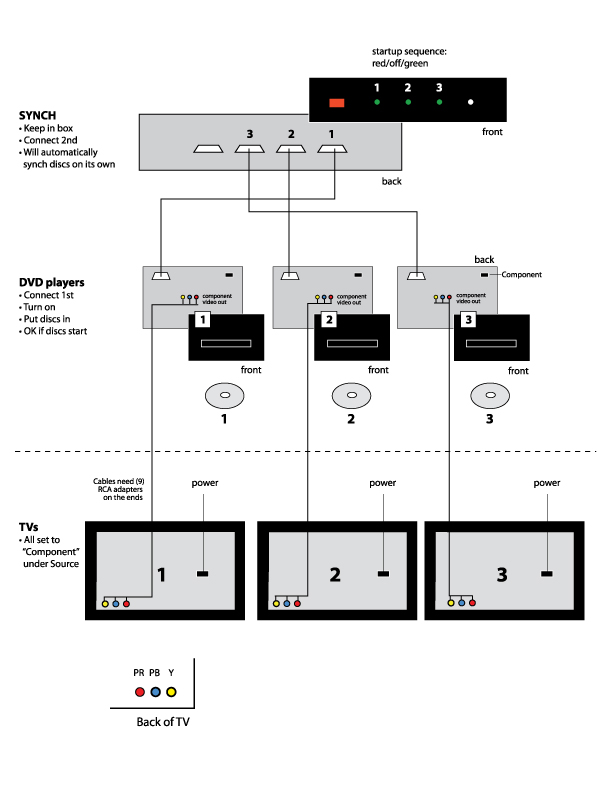
Media connection chart
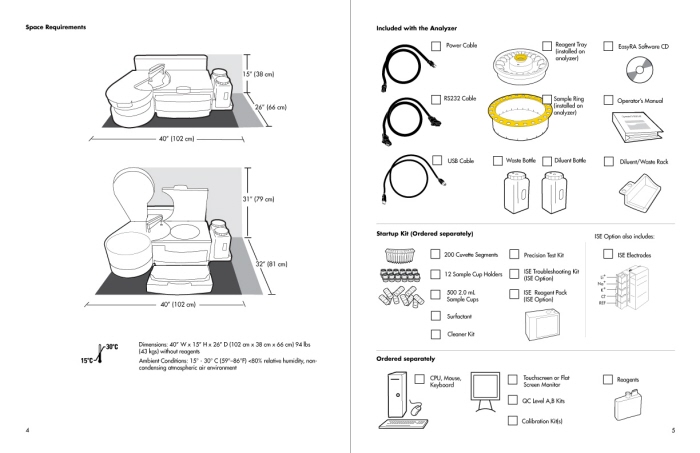
Spread from Quick Start Guide
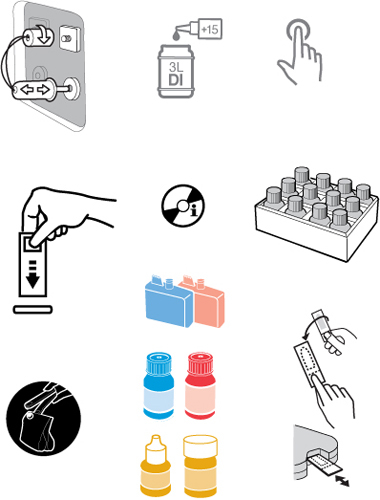
Label graphics
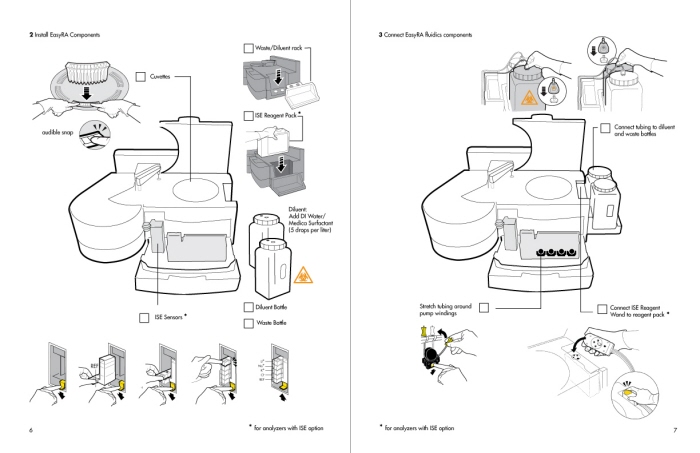
Spread from Quick Start Guide
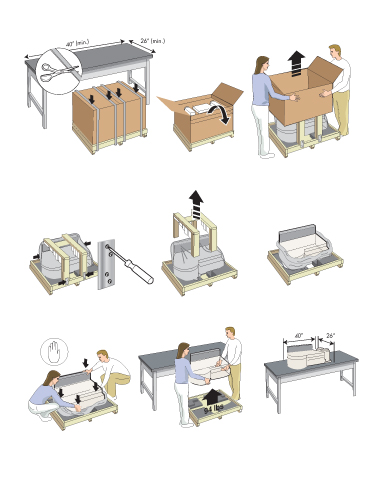
gLike
Information Design
