
gLike
Sugar use by type of industry from 1949 to 2012
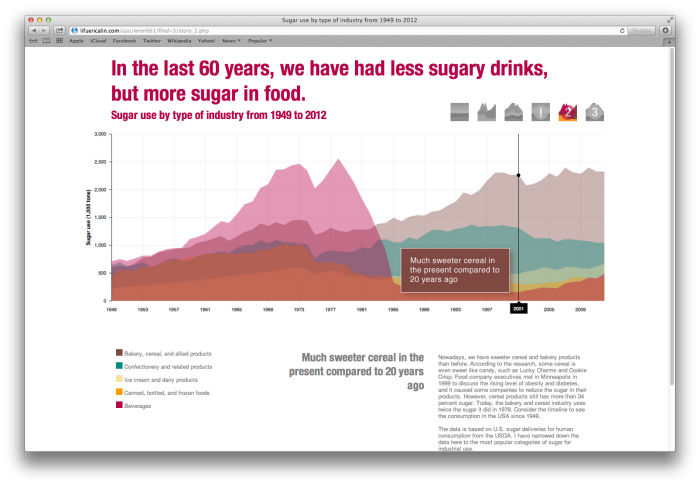
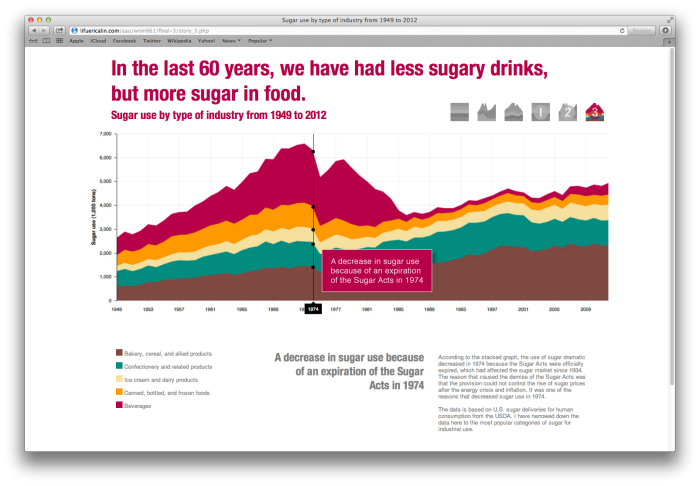
This data visualization shows a sugar history. In the last 60 years, we have had less sugary drinks, but more sugar in food. Sugar is one of the important cultural and food elements in our lives. The chart shows a history of the sugar industry from 1949 to 2012 in the USA. There are three stories explored in the chart: a decrease in sugar use because of the expiration of the Sugar Acts in 1974, the introduction of diet beverages in the 1960s, and much sweeter cereal in the present compared to 20 years ago.
The data is based on U.S. sugar deliveries for human consumption from the USDA. I have narrowed down the data here to the most popular categories of sugar for industrial use.